Total Cost of Ownership Across Fragmented Endpoint Stacks
Companies waste millions running 83 fragmented security tools when unified platforms cost less.
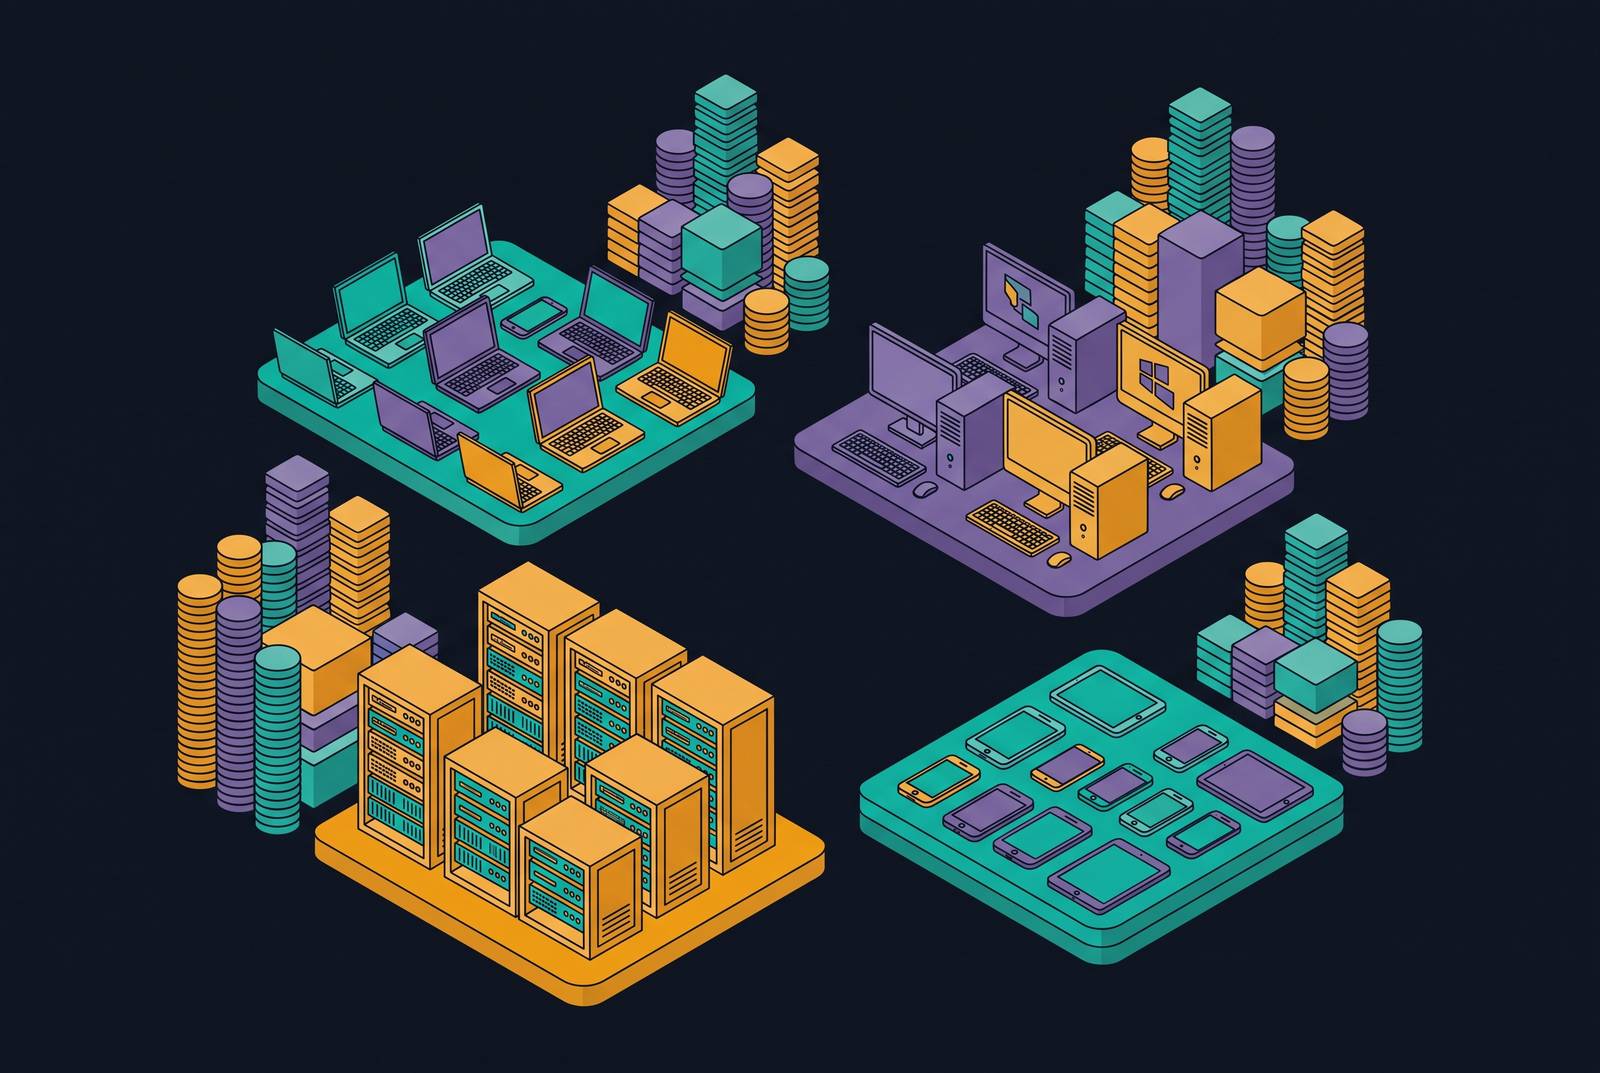
Supply drives most of this. IT-Harvest tracks more than 4,000 vendors and over 10,000 products in the cybersecurity market, and the first half of 2025 alone saw $9.4 billion go into new cybersecurity and privacy startups. Every one of those dollars eventually turns into a point solution knocking on a CISO's door with a narrower, sharper pitch than the last one. The market rewards specialization over consolidation, so it keeps making more things to buy, and buyers keep buying them one at a time.
The result shows up plainly at the organizational level. IBM and Palo Alto Networks research found the average company now runs 83 different security solutions from 29 separate vendors. That's the residue of a decade of point-solution purchasing, one reasonable-sounding decision at a time, none of them wrong on its own terms.
Even the layer meant to unify everything else is fragmented, and that detail alone undercuts any claim that this is a solvable procurement problem. A 2024 IDC study cited by Tangoe found more than 70% of enterprises run two or more unified endpoint management platforms at once, and over a third run three or more. The tool bought specifically to kill sprawl has, in most organizations, become another instance of it. The fix for fragmentation is itself fragmented, and that should worry anyone still betting on procurement discipline alone to solve this.
Best-of-breed buying, purchase after purchase, over years, produces exactly this outcome. Nobody designed the resulting stack. That's exactly why nobody can explain, on demand, what all 83 tools are actually for.
What endpoint tool licensing actually costs across a fragmented stack
Per-seat pricing looks manageable in isolation, and that's the trap. Basic endpoint security runs $5 to $30 per user or device per month for small businesses, while enterprise-grade coverage often lands between $100 and $200 or more per endpoint per year. Microsoft's Defender for Endpoint P1 lists around $3 per user per month standalone; P2, which adds threat hunting and automated investigation, runs closer to $5.20. Add a dedicated Identity Threat Detection and Response platform and that's another $12 to $22 per user per month, a separate line most fragmented stacks carry right alongside EDR.
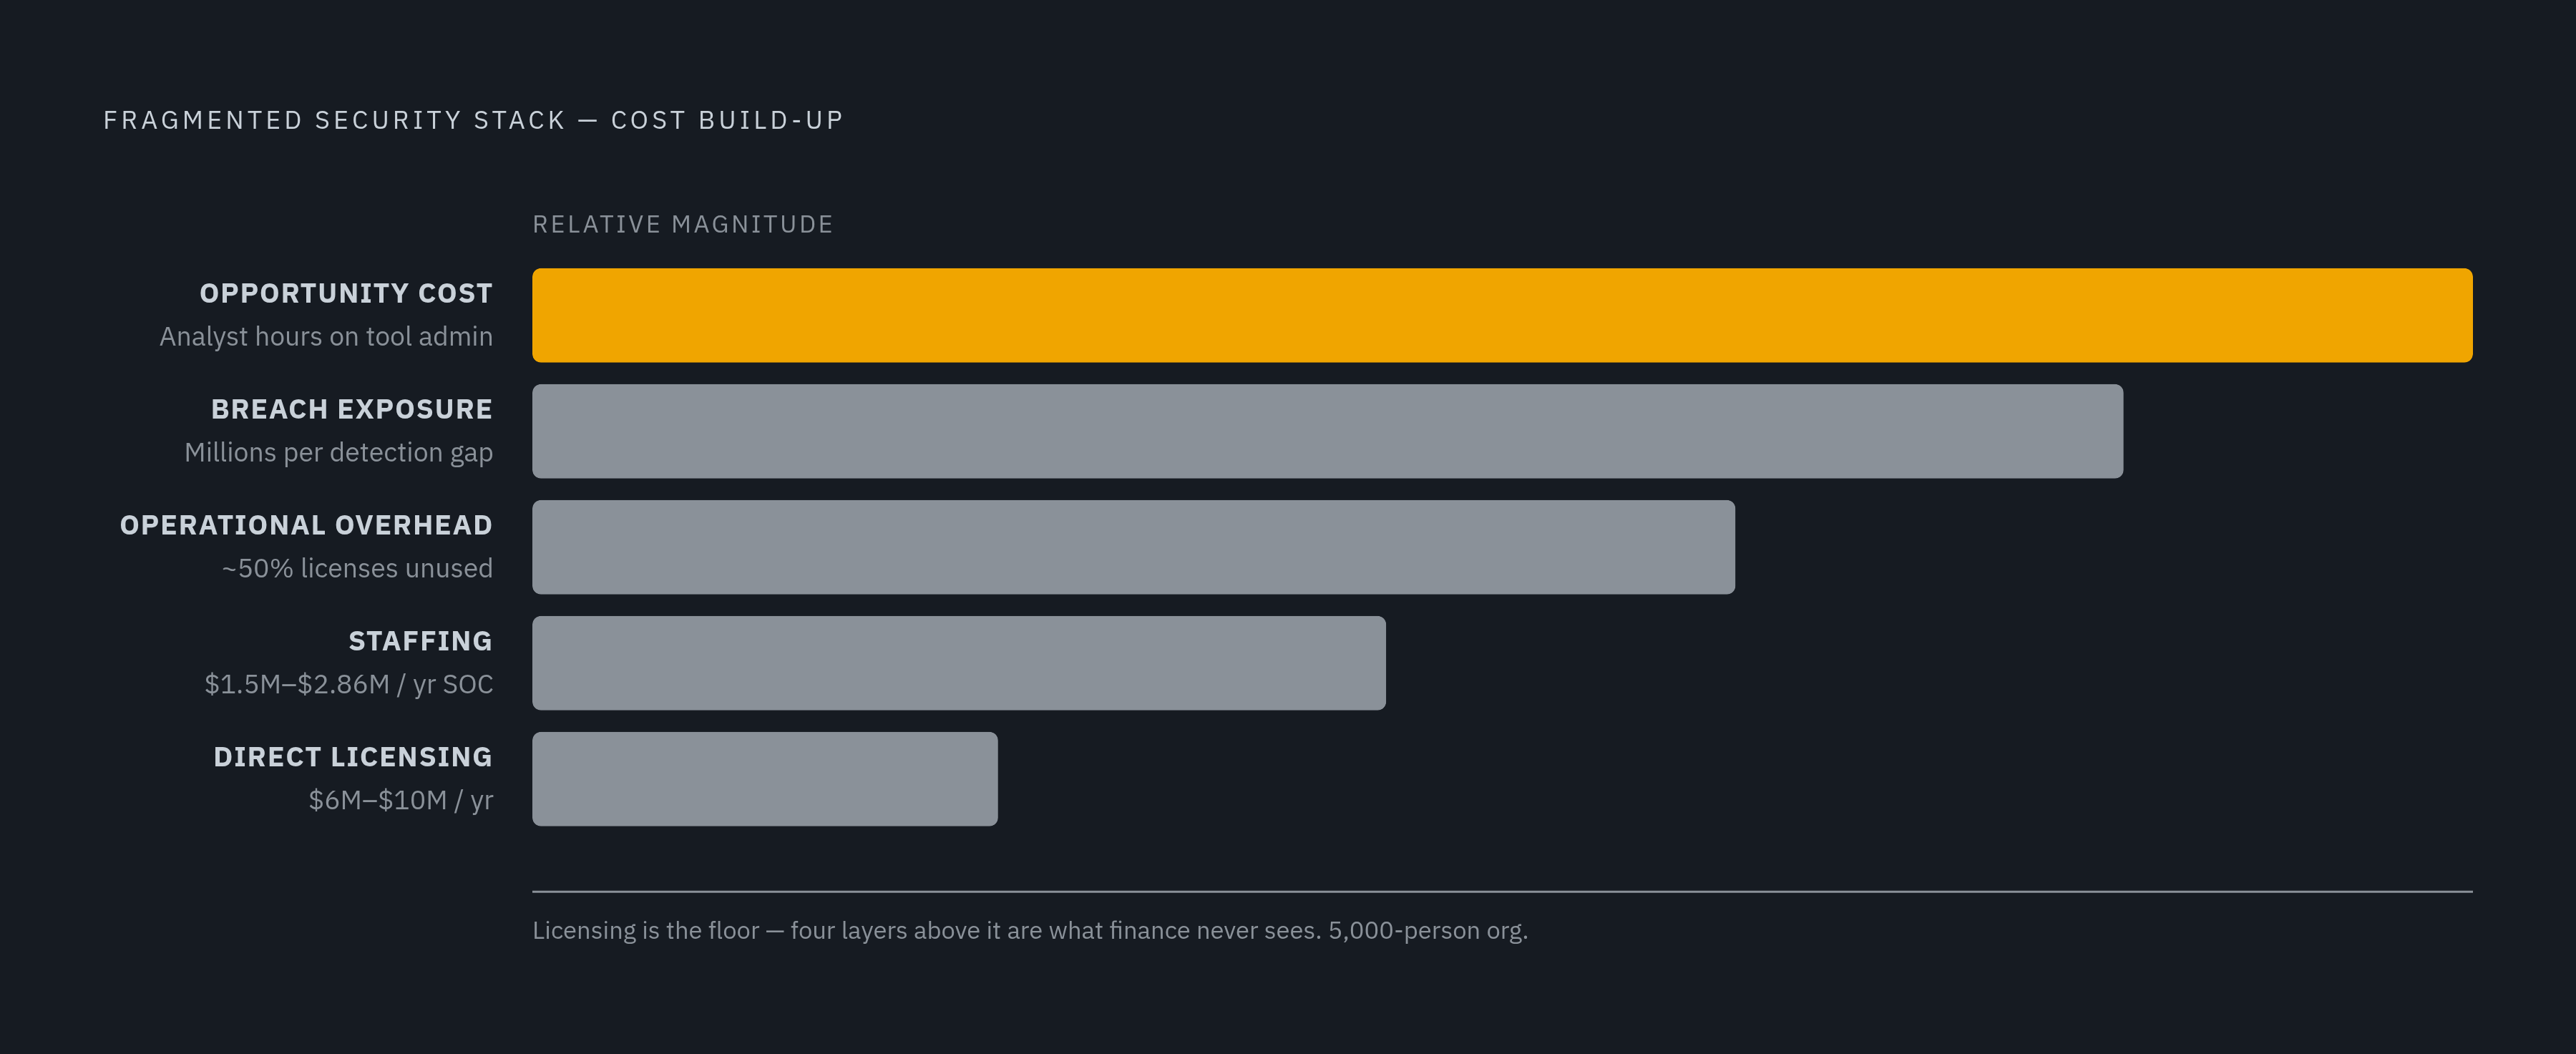
None of those numbers looks alarming alone. The problem is nobody runs just one of them. Run five or eight at once and a handful of affordable per-seat figures turns into a real per-endpoint total, before a single hidden cost gets added. At enterprise scale, a traditional fragmented security stack costs $6 million to $10 million a year for an organization of 5,000 people. That's the licensing floor, and this whole piece is built around the cost that sits above it.
Multi-year contracts help at the margins, and only at the margins. A 20% to 30% discount on each individual tool doesn't touch the structural cost of running many tools at once; it just makes the same sprawling architecture slightly cheaper to maintain.
SIEM pricing compounds the problem in a way procurement teams tend to miss until the invoice arrives. Platforms like Splunk and QRadar price by gigabyte ingested or by events per second, which pushes annual costs into the millions at enterprise scale. Many organizations respond by deliberately limiting how much log data they collect, a cost-control move that quietly creates blind spots and raises breach risk down the line. That trade amounts to buying a cheaper invoice today by paying for it later, in a breach that took longer to find.
Licensing is the number every finance team already tracks. It's typically the smallest slice of the real total, and the rest of this piece exists to size the part finance never sees.
The staffing multiplier: why every tool added to the stack costs more than its license
SIEM economics make the pattern easiest to see. Enterprise SIEM staffing typically costs two to three times the license fee itself. For Elastic Security specifically, UnderDefense's 2025 analysis found the license represents just 20% to 40% of actual total spend. The rest is people, and people are the part most budget models forget to multiply correctly.
"Staffing cost" undersells what's actually being spent, because salary alone isn't the number that matters. The U.S. Bureau of Labor Statistics put the median salary for information security analysts at $124,910 in May 2024. Wages make up 70.1% of total compensation, with benefits accounting for the remaining 29.9%, a fully loaded multiplier of roughly 1.43x on base salary. The figure on the offer letter undercounts what the organization actually pays, and most TCO estimates quietly use it anyway.
Add tooling and overhead to personnel and a mid-range Security Operations Center runs $1.5 million to $2.86 million a year. Staffing dominates that figure, but the tool stack driving the workload behind it is the part most budget models leave out entirely.
The skills gap makes every open seat expensive in a way that compounds fragmentation rather than sitting beside it. ISC2 puts global demand for cybersecurity professionals at 10.2 million against a current workforce of 5.5 million, a gap of 4.76 million people. That gap doesn't close on its own; it gets filled with overtime, burnout, and analysts who quit within a year of being hired.
Here's the part most finance teams get backwards: fragmentation doesn't just make the shortage more expensive to sit inside, it makes the shortage worse. Each added tool demands its own training, its own context-switching, its own pocket of specialized know-how. A ten-tool stack asks more of an analyst's attention than a unified platform running equivalent controls, platforms like Zip, which consolidates device management, identity, and endpoint security into a single managed program, exist partly to close that gap, even when the underlying protection is roughly the same. Headcount scales with tool count more than with risk, and almost no budget model accounts for that directly.
Hidden operational costs that erode value without appearing on any invoice
Performance drag is real and almost nobody measures it. The average enterprise endpoint carries between two and five security agents at once, covering antivirus, EDR, encryption, and log collection separately. Gartner puts the typical performance cost of security controls at 5% to 20% slower endpoints, a tax paid quietly across every device in the fleet, every day. Multiple agents fighting over the same CPU and memory also produce telemetry conflicts and false positives, which drives up the analyst hours spent chasing signals that turn out to be noise.
Wasted spend follows the same shape. Tangoe reports that in 2025, almost half of all paid SaaS licenses across the market went unused, more than $20 billion in wasted spend industry-wide. Security tools track the same pattern: capabilities overlap across EPP, DLP, EDR, and anti-malware layers, and duplication survives because auditing for it isn't anyone's actual job. Nobody owns the redundancy, so it just sits there, renewing itself every January.
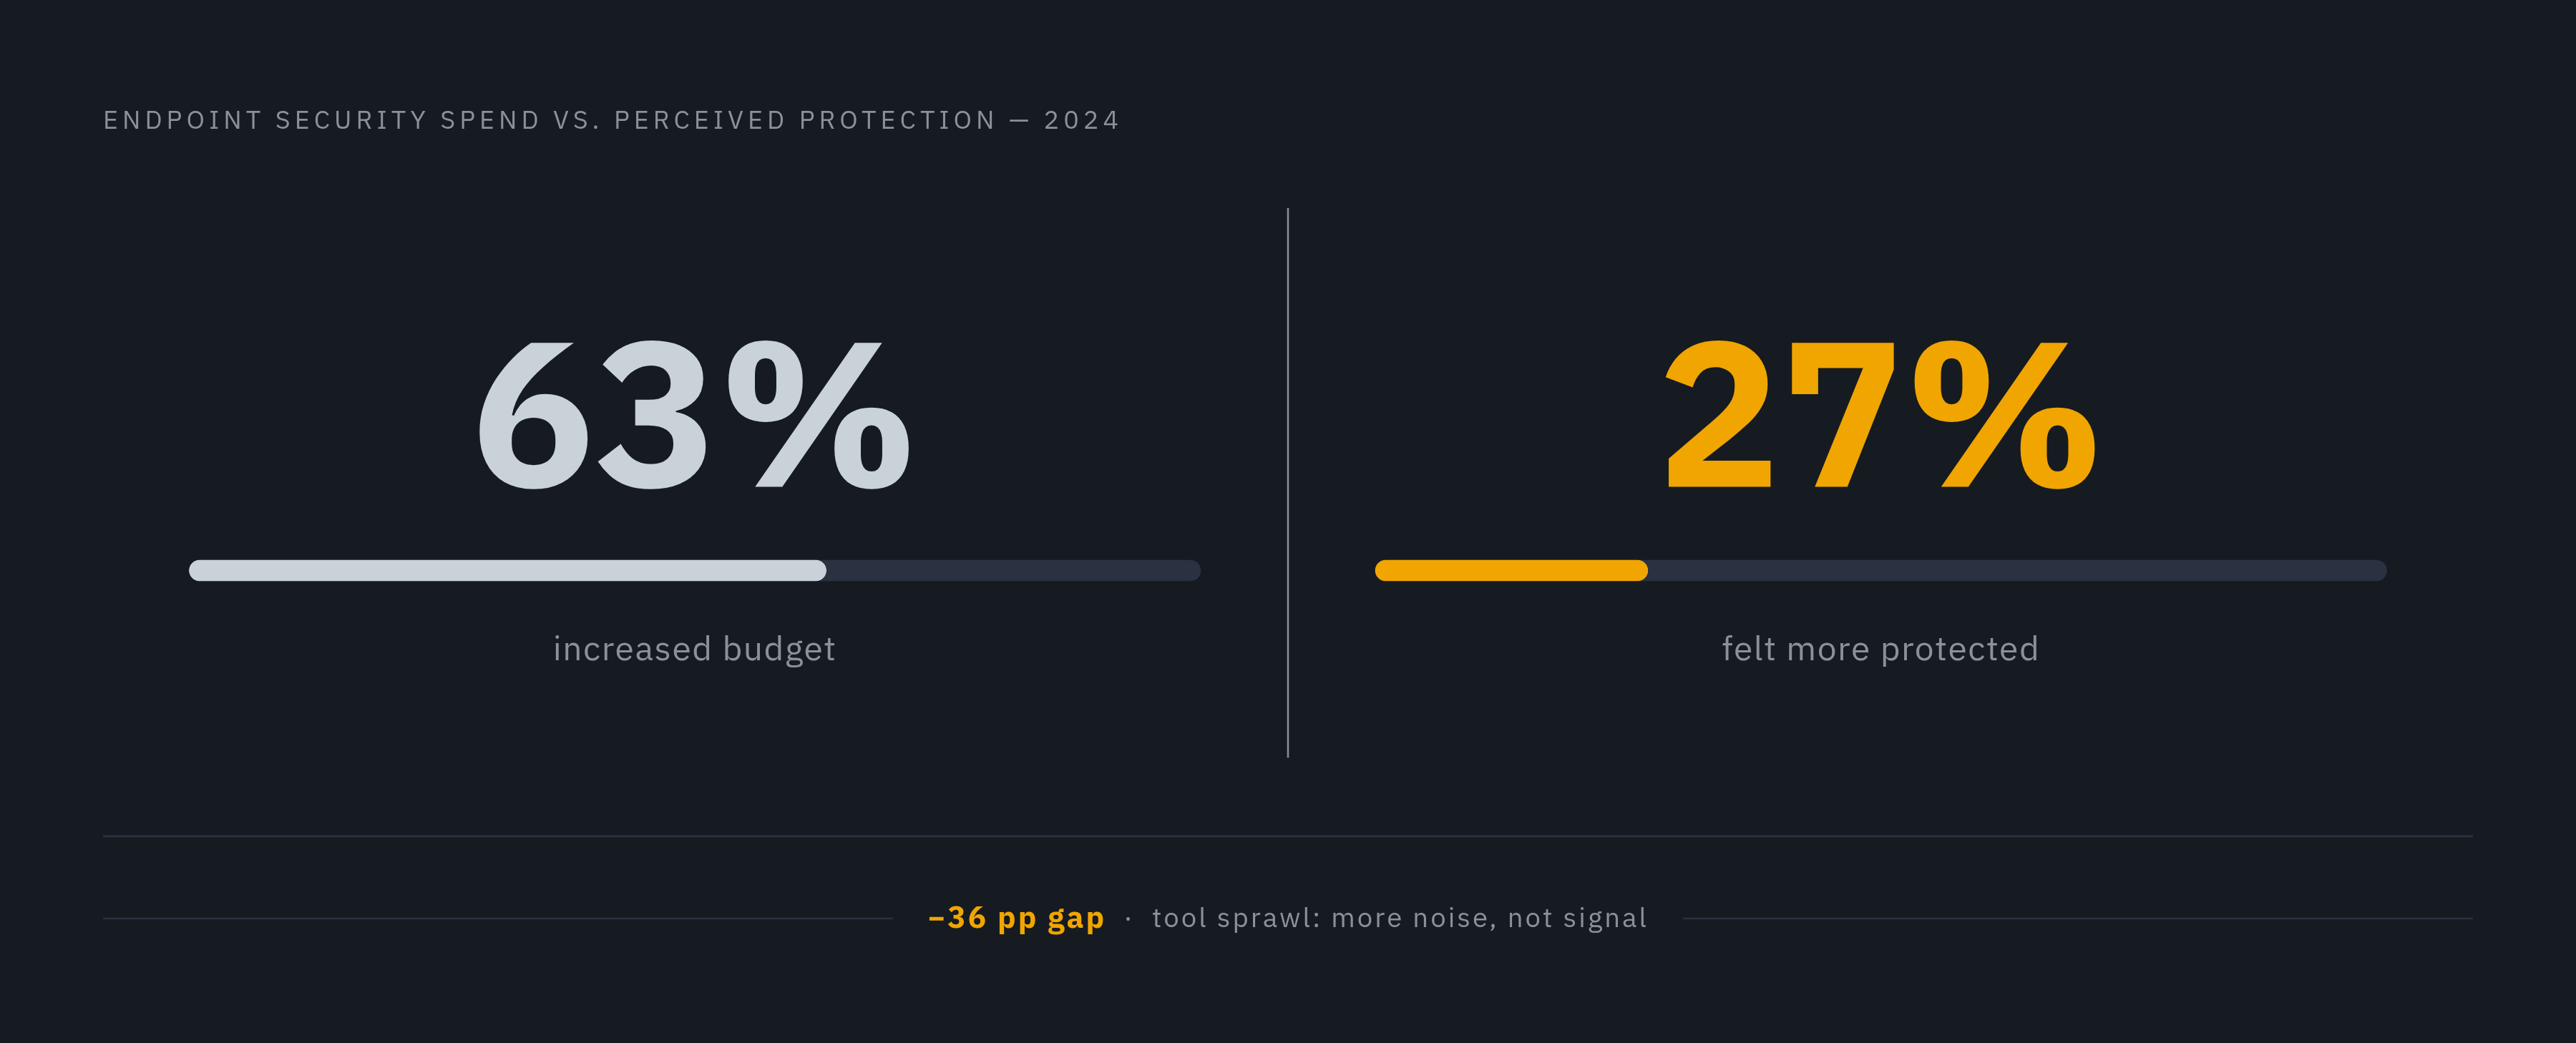
The perception gap might be the starkest number here. In 2024, 63% of organizations increased their endpoint security budgets, yet only 27% felt their protection had meaningfully improved. Tool sprawl was the reason most often cited. More tools produced more noise, not more signal, and the people paying for it noticed.
Then there's the maintenance nobody bills for. Every vendor relationship needs contract management, renewal tracking, API integration, and update testing. None of it shows up as a line item. It just eats engineering and IT management hours, in the background, until someone finally asks where the week went.
Regulation adds a final layer of exposure. Europe's NIS2 directive, in force since October 2024, requires more than 160,000 organizations to run certified endpoint controls, with fines reaching up to EUR 10 million. Fragmented visibility makes both compliance attestation and audit prep more expensive to produce on demand.
How fragmented stacks amplify breach costs through slower detection and identity gaps
Detection speed is where the money really shows up. Research on breach costs consistently finds that breaches detected faster cost significantly less than those that linger; the gap between faster and slower detection runs into the millions. That multimillion-dollar gap traces almost entirely to how fast the breach got found.
Fragmented stacks stretch out detection time almost by design. Siloed tools throw off disconnected telemetry, and someone has to sit there manually correlating it, piecing together a picture across five or six consoles that a unified platform would have assembled on its own. That correlation lag is an architecture problem wearing a staffing costume.
The U.S. context makes this especially expensive. The U.S. context makes this especially expensive, with breach costs driven by regulatory fines, legal fees, customer compensation, and the cost of detection itself running well above the global average. A fragmented stack that slows detection doesn't add cost in one place; it multiplies every one of those components at once.
Heavily regulated sectors illustrate what that multiplication looks like in practice, where slow detection compounds across every cost component inside an unusually fragmented environment.
Identity is the gap most fragmented stacks never close, and it's the one that should worry security leaders most. A growing share of attacks are now malware-free, relying on valid credentials to move laterally rather than on code an antivirus product might catch. Good EDR alone is structurally insufficient against that pattern; it was built to catch malware, and a legitimate-looking login behaving strangely falls outside its job description. Organizations running separate EDR and ITDR tools, assuming they run ITDR at all, face correlation delays between the two systems. Organizations with no integrated identity protection have no detection layer for credential-based attacks, full stop. The attacker doesn't hack in. They log in, using a password that checks out fine, and a stack built to catch malware has nothing to say about that.
Breach cost is also the layer most absent from vendor sales conversations, precisely because it's probabilistic. Budget owners discount a cost that might not land this year. But its expected value, calculated across the multi-year life of a stack, typically outweighs licensing and staffing costs combined.
What consolidation actually changes in the TCO model
The IBM and Palo Alto Networks January 2025 study, "Capturing the Cybersecurity Dividend," makes the clearest quantified case for what changes when the stack gets smaller. Platformized organizations detected and contained security incidents measurably faster than fragmented peers. Average ROI came in significantly higher for platformized organizations than for those that hadn't consolidated, representing a markedly better return on the same category of spend. And a large majority of security executives who'd adopted platformization said security had become a source of business value, compared with very few of those who hadn't. Anyone still treating consolidation as an open question isn't reading that gap closely enough.
Consolidation touches every layer described above, and it's worth being specific about the mechanism in each case, not just the outcome. Licensing drops through fewer contracts and negotiated platform pricing that kills redundant capability. Staffing costs shrink because analysts work from a single interface instead of switching context across a dozen consoles, and the specialized-expertise-per-tool problem stops compounding. Operational drag falls because one agent instead of two to five removes the performance conflicts and duplicate alerts that were burning analyst time. Breach cost falls because faster detection closes part of that $1.88 million gap, while integrated identity and endpoint coverage finally addresses the credential-based attacks that siloed tools structurally miss.
In the same IBM and Palo Alto Networks research, a majority of surveyed executives said fragmentation directly limits their ability to deal with cyber threats. Consolidation saves money and removes a limitation the people running these programs named outright, in their own words, to the people surveying them.
The case is sharper for small and mid-sized organizations than for large ones, and this is where the argument stops being theoretical. Large enterprises can afford to run both platforms and point solutions side by side, buying redundancy as insurance against any single vendor's blind spot. Mid-market organizations rarely have that luxury. For them, the platform model is the only realistic route to full coverage that doesn't require headcount to grow in lockstep with the tool count. Treating platform and point-solution strategies as equally viable options for a 400-person company is where most mid-market security budgets quietly go to die.
Building a TCO model your organization can actually use
Five layers need counting, roughly in order of how visible they already are. Skip any one of them and the eventual comparison means nothing.
Direct licensing comes first: add up every active endpoint, identity, management, and SIEM contract, then apply the 20% to 30% multi-year discount reality to get actual spend rather than list price. Staffing and labor comes next: apply the 1.43x fully loaded multiplier to analyst salaries, and estimate the hours per week the team spends on tool-specific admin, tuning, and vendor management, not threat work.
Operational overhead is the third layer, and it takes an actual audit to see, not a guess from memory. Count active agents per endpoint, log integration maintenance hours, and run a license utilization review against the roughly-half-unused benchmark showing up across the SaaS market broadly. Fourth comes breach exposure as an expected value, not a hunch: apply the multimillion-dollar cost gap between sub-200-day and over-200-day detection, weighted by the organization's current mean time to detect, and add regulatory fine exposure under whatever frameworks apply, NIS2, HIPAA, or others. Fifth is opportunity cost: the hours analysts spend managing tools instead of chasing actual threats. It won't produce a clean dollar figure, but it forces the conversation about what the team is actually doing all day.
A few places consistently get undercounted even by teams trying to be thorough. SIEM log limitations create blind spots whose cost stays invisible right up until a breach happens and the gap in the timeline becomes obvious. Credential-based attack exposure goes unpriced whenever EDR and identity protection aren't wired together. Compliance prep time across a fragmented audit trail rarely gets logged as a cost at all, even though someone is spending real hours reconstructing it every audit cycle.
Once those five layers are estimated, weigh a platform alternative against the full cost of the fragmented stack, rather than against a single license line. The comparison almost always looks different once staffing multipliers and breach exposure sit on the same page as the subscription price. A number that only counts licensing was never a total cost of anything, and no security leader should keep presenting it as one.
Building this model isn't an accounting exercise. It's what makes the fragmented stack's real cost visible, so whatever gets decided next gets decided on numbers that were actually counted, not the ones that happened to land on an invoice.