Device-to-Technician Ratio Benchmarks in SMB IT Operations
Automation and environment complexity reshape what staffing ratios actually mean.
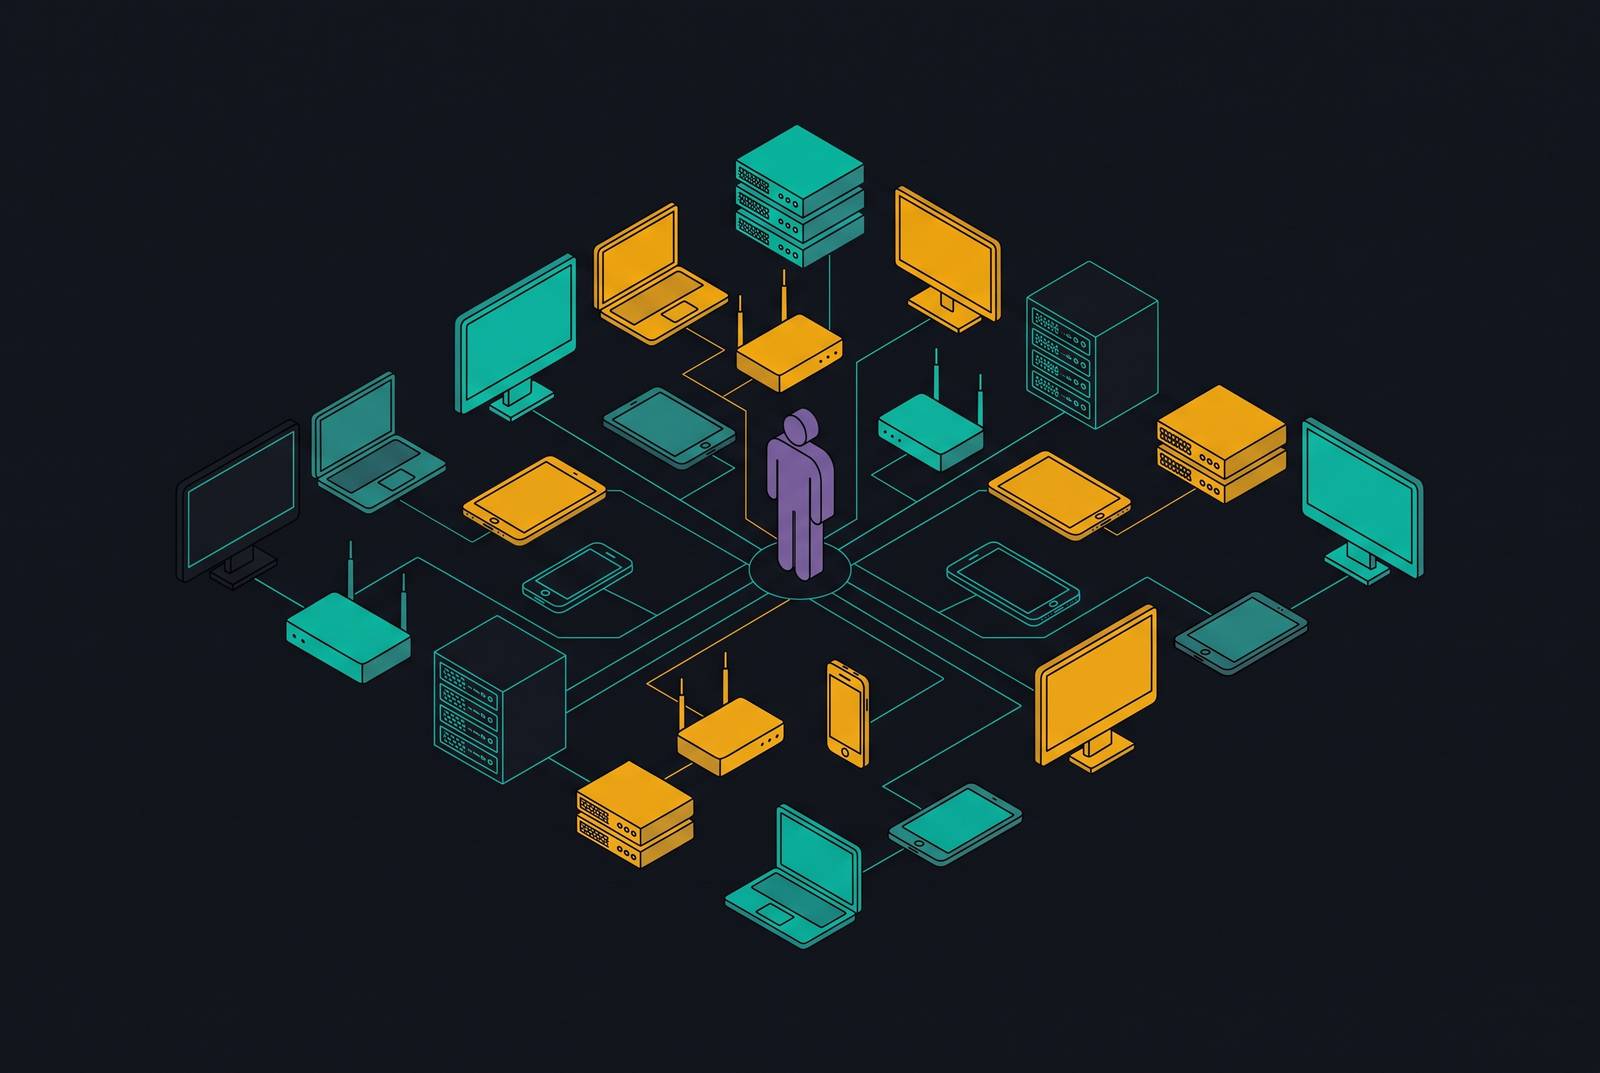
The ratio depends on what produces it: how much automation is doing the grunt work, how many tools the technician has to juggle, and how complicated the environment actually is. Get those three variables right, and a ratio that looks alarming on a spreadsheet might be perfectly healthy in practice.
Why device-to-technician ratios exist
At its simplest, the ratio is IT staff headcount divided by the number of end-users or devices they're responsible for. That's it. But "IT staff" and "devices" can mean different things depending on who's asking, which is where the confusion usually starts.
There are two flavors in common use. The user-based ratio measures workforce coverage: one IT staff member per some number of employees. The device or endpoint-based ratio measures workload density instead: one technician per some number of managed endpoints. SMBs run into this number constantly, in hiring decisions, budget meetings, and vendor pitches, usually cited without any of the context that would make it meaningful.
A general IT staffing ratio compares the whole IT org against total headcount, while an endpoint-specific ratio isolates technicians managing devices from the broader IT function. Mixing these up is how a lot of bad staffing decisions get made. Neither ratio is a target to hit. Both are descriptive snapshots of how workload happens to be distributed right now, and that snapshot can describe a lean, well-tooled team just as easily as it can describe one about to burn out.
What the benchmark numbers say across company sizes and industries
Start with the cross-industry baseline: roughly one IT staff member per 27 employees, according to IT operations research cited by TalentMSH. Narrow it to the help desk specifically and Gartner recommends something closer to 1:70, one service desk analyst per 70 users, which is a tighter and more specific measure than total IT staffing.
Company size changes the math substantially. Large enterprises above 5,000 employees stretch anywhere from 1:50 to 1:200. Notice what's happening there: mid-size companies actually carry a higher ratio than small ones, which seems backwards until you consider that scale usually brings standardized, automated processes that a 40-person shop hasn't built yet talentmsh.com.
Industry matters just as much as size. Finance, healthcare, and government cluster around 1:50 to 1:100, driven down by compliance obligations that eat technician time regardless of device count talentmsh.com. Tech and SaaS companies range from 1:30 to 1:100 depending on how cloud-reliant they are digacore.com talentmsh.com. Retail and manufacturing stretch out to 1:200 or even 1:500, since a huge share of employees need almost nothing from IT day to day talentmsh.com. Education and public sector run 1:300 and up, chronically underfunded, and the sources are blunt about the consequence: documented IT burnout digacore.com.
Then there's the endpoint-specific view, which is a separate measure entirely from user-based ratios.
Sit with that spread for a second. That's not noise, that's the entire point: these benchmarks describe a distribution, not a target. A number that looks like an outlier might just be a different kind of normal. Small businesses (1–500 employees) benchmark at a ratio of 1:18 (one IT team member per 18 employees) goworkwize.com. Mid-size businesses (500–5,000 employees) benchmark at a ratio of 1:25 goworkwize.com. MSP practitioner literature cites a range of 250–400 fully managed endpoints per technician medium.com. A commonly cited "gold standard" is 350 endpoints per technician Acronis. Gartner's 2025–2026 figures give an overall median, via the University of Wisconsin DoIT report. The 2025 median is 398 endpoints per technician, with an interquartile range of 259–645 Gartner / University of Wisconsin DoIT. The 2026 median is 408 endpoints per technician, with an interquartile range of 276–749 Gartner / University of Wisconsin DoIT. The Gartner interquartile spread of 276–749 shows the upper bound is nearly twice the median, underscoring that benchmarks describe distributions, not targets Gartner / University of Wisconsin DoIT.
How the same ratio can mean opposite things depending on environment complexity
So what actually separates them? Complexity, mostly, and it cuts in both directions.
Some factors push the number down: more staff are needed per device. Regulated industries carry compliance obligations that multiply workload independent of how many machines are actually deployed. A mixed fleet, different operating systems, BYOD policies, remote-first teams, takes more per-device handling time than a uniform one.
Other factors push the ratio higher: fewer staff are needed per device. A standardized, homogeneous fleet, common in retail and manufacturing, needs a lot less hand-holding. Cloud-heavy architecture cuts down on-premise infrastructure overhead. Mature, well-documented processes reduce how often things escalate into a ticket.
There's a compounding wrinkle here too. A company running 1:80 or 1:100+ isn't automatically understaffed, it might just have a less complex environment talentmsh.com. Meanwhile a company at a tighter-looking 1:40, if its environment is fragmented, multi-OS, and compliance-heavy, can still be genuinely under-resourced talentmsh.com. The ratio alone won't tell you which one you're looking at. The interquartile spread of 276–749 in the 2026 Gartner data means two organizations at opposite ends of that range both qualify as "normal" Gartner / University of Wisconsin DoIT. NinjaOne's guide notes that high-security environments benchmark cybersecurity specifically at 1 dedicated specialist per 5–10 general IT staff. NinjaOne's guide notes that as organizational complexity grows, a growing company inadvertently becomes a more attractive target, requiring IT staffing to scale not only to manage day-to-day operational demands but also to maintain a proactive security posture.
Automation's Shift in What a Single Technician Can Realistically Manage
Automation has quietly rewritten what "one technician" can handle. Datto data cited by Medha Cloud shows automation handled 38% of MSP service delivery tasks in 2026, up from 22% in 2023, concentrated mostly in ticket routing, patch deployment, alerting, and basic remediation. That's a real shift in less than three years, not a marginal one.
The consequence for ratios is direct. The tasks that used to eat the most technician hours are increasingly running without a human touching them, so a technician overseeing automated patch deployment can reasonably manage far more endpoints than one clicking through updates by hand. Which means the Gartner 2026 median of 408 endpoints per technician isn't describing a technician working alone, it's describing an environment where meaningful automation is already doing part of the job Gartner / University of Wisconsin DoIT. A team without that automation in place has no business benchmarking itself against that number.
Automation isn't just about speed either. The Workwize research notes it also reduces errors, which is a separate benefit from the labor math and part of why automation "maximizes IT team impact" beyond simple headcount arithmetic. But the benefit only holds if the automation is trustworthy. Poorly configured automation doesn't just fail to help, it invents new incident categories nobody budgeted time for. Automation, in other words, is a tooling lever. It's not a substitute for hiring, and it's not free once deployed, it has to be maintained.
Tool Fragmentation and the Real Cost of a Given Ratio
Most IT departments aren't running one platform; they're running three to six disconnected tools for endpoint monitoring, patching, ticketing, and reporting, according to Syncro's UEM comparison. Each one has its own console, its own alert queue, its own renewal date to track.
That fragmentation is invisible to a device count, but it's not invisible to the technician doing the work. A technician managing 300 endpoints across four separate tools is doing more coordination labor than one managing 400 endpoints from a single unified platform, and the raw ratio doesn't capture that difference at all digacore.com. UEM and RMM have effectively converged as categories, and the meaningful difference between platforms now is whether one also covers help desk and identity management, not whether it's labeled one thing or the other.
So when an SMB looks at its ratio and doesn't like what it sees, the tool count deserves just as much scrutiny as the headcount does. A team that looks understaffed on paper might just be overtooled. And the cost isn't only measured in technician hours lost to switching consoles: it appears in renewal cycles piling up, in visibility gaps where one tool doesn't talk to another, and in pricing itself, where Syncro's analysis of nine platforms found per-technician, per-user, and per-device pricing models that produce wildly different effective costs for the exact same fleet. Getting the staffing ratio right doesn't help much if the underlying tool cost math is built on units that don't even compare to each other.
What happens when the ratio stretches too far without tooling support
Push a ratio too far without the tooling to back it up, and the failure modes are well documented, not hypothetical. NinjaOne's 2026 guide lists three: employee burnout and high turnover, increased downtime as overburdened staff fall behind on requests, and delayed security patches as critical updates are constantly pushed back.
That last one deserves more weight than the other two combined. Delayed patching isn't an abstract risk sitting somewhere on a compliance checklist, it's the actual mechanism through which a large share of breaches happen. And the timing here is bad, because SMBs are more worried about this than ever: the State of SMB Cybersecurity Report from ConnectWise and Vanson Bourne found 57% of SMBs now rank cybersecurity as their top business priority, a 14-point jump from the year before, with 61% afraid a major attack could shut the business down entirely State of SMB Cybersecurity Report / ConnectWise and Vanson Bourne.
There's a bitter irony sitting inside that data. The organizations most anxious about security risk are frequently the same ones whose stretched ratios leave the least room to actually do anything about it. Education and the public sector make the case in the starkest terms: ratios at 1:300 and above occur repeatedly alongside documented IT burnout, and that's not an edge case worth dismissing; it's the predictable result of chronic understaffing left unaddressed for years goworkwize.com digacore.com. None of this is an argument for hiring aggressively just to hit a lower number. It's an argument for figuring out which layer of the stack is actually causing the strain before writing a check for either one.
Reading your own ratio: staffing problem or tooling problem
So which is it. Is the ratio high because there genuinely aren't enough people, or because the tools and processes in place aren't multiplying what the existing team can already do?
A few signals point toward a real staffing problem. Ticket backlog keeps growing even though the device count has stayed flat. Security tasks like patch management, vulnerability review, and access control keep getting deferred. Incidents take longer to close month over month. And the team never gets a moment for proactive work, because everything that comes in is reactive by default.
A different set of signals points toward a tooling problem instead. Technicians bounce between multiple consoles just to finish one task. Alerts from different systems don't correlate with each other, so someone's manually stitching the signals together by hand. Patch status, device compliance, and identity state all live in separate places, or in some cases nowhere visible. And automation that's supposed to be running either isn't, or is running but nobody on the team actually trusts its output.
NinjaOne's 2026 guide recommends a fairly straightforward process for sorting this out: catalog every IT asset, look honestly at current helpdesk ticket volume, and match staffing levels against actual service-level agreements rather than a benchmark pulled from somewhere else. Small businesses can run perfectly well at ratios that look alarming out of context. A 1:80 or even 1:100+ ratio is entirely viable when managed services or consolidated tooling is absorbing work that in-house staff would otherwise have to do alone talentmsh.com. So before adding headcount, audit the tool stack first. If three to six consoles are the actual source of the overload, consolidating them may recover more usable capacity than a new hire would.
None of the headline benchmarks were built with SMBs specifically in mind.
SMBs actually look structurally different once you dig in. SMB IT staff tend to be generalists covering a wide range of functions, not specialists narrowly focused the way staff at larger organizations often are.
Outsourcing changes the picture further. Small businesses can function at ratios as high as 1:100 once managed services are factored in, and whether that ratio looks sustainable or alarming depends entirely on whether those managed services count as part of the denominator. And this isn't a category short on money overall. IDC reports SMBs spent $1.1 trillion on IT globally in 2025, with 7.2% growth projected for 2026. So the constraint usually isn't aggregate budget.
What's actually missing more often is internal expertise to judge whether a given ratio reflects a real problem, plus the specialist depth to handle security functions that benchmarks tend to treat as a separate line item from general IT staffing. SMBs are systematically likely to be under-resourced on security relative to the benchmark, even when their overall IT looks perfectly healthy by every other measure. The Gartner figures come from institutional/enterprise environments and the 350–400 endpoint figures come from MSP operations literature, with neither derived from in-house SMB IT teams, which have different cost structures and risk profiles Acronis. Small businesses (1–500 employees) average a 1:18 ratio per the Organizing for Results: IT Structures and Staffing Survey (people3, Mercer Human Resource Consulting, and ITAA), republished by Workforce.com, far more IT-staff-dense than the cross-industry average of 1:27, reflecting that SMB IT generalists handle a wider range of functions than specialists at larger organizations talentmsh.com goworkwize.com. Cybersecurity is benchmarked at 1 dedicated specialist per 5–10 general IT staff, a ratio that at SMB scale implies a security hire is only justified once the IT team has grown to a size most SMBs never reach.